
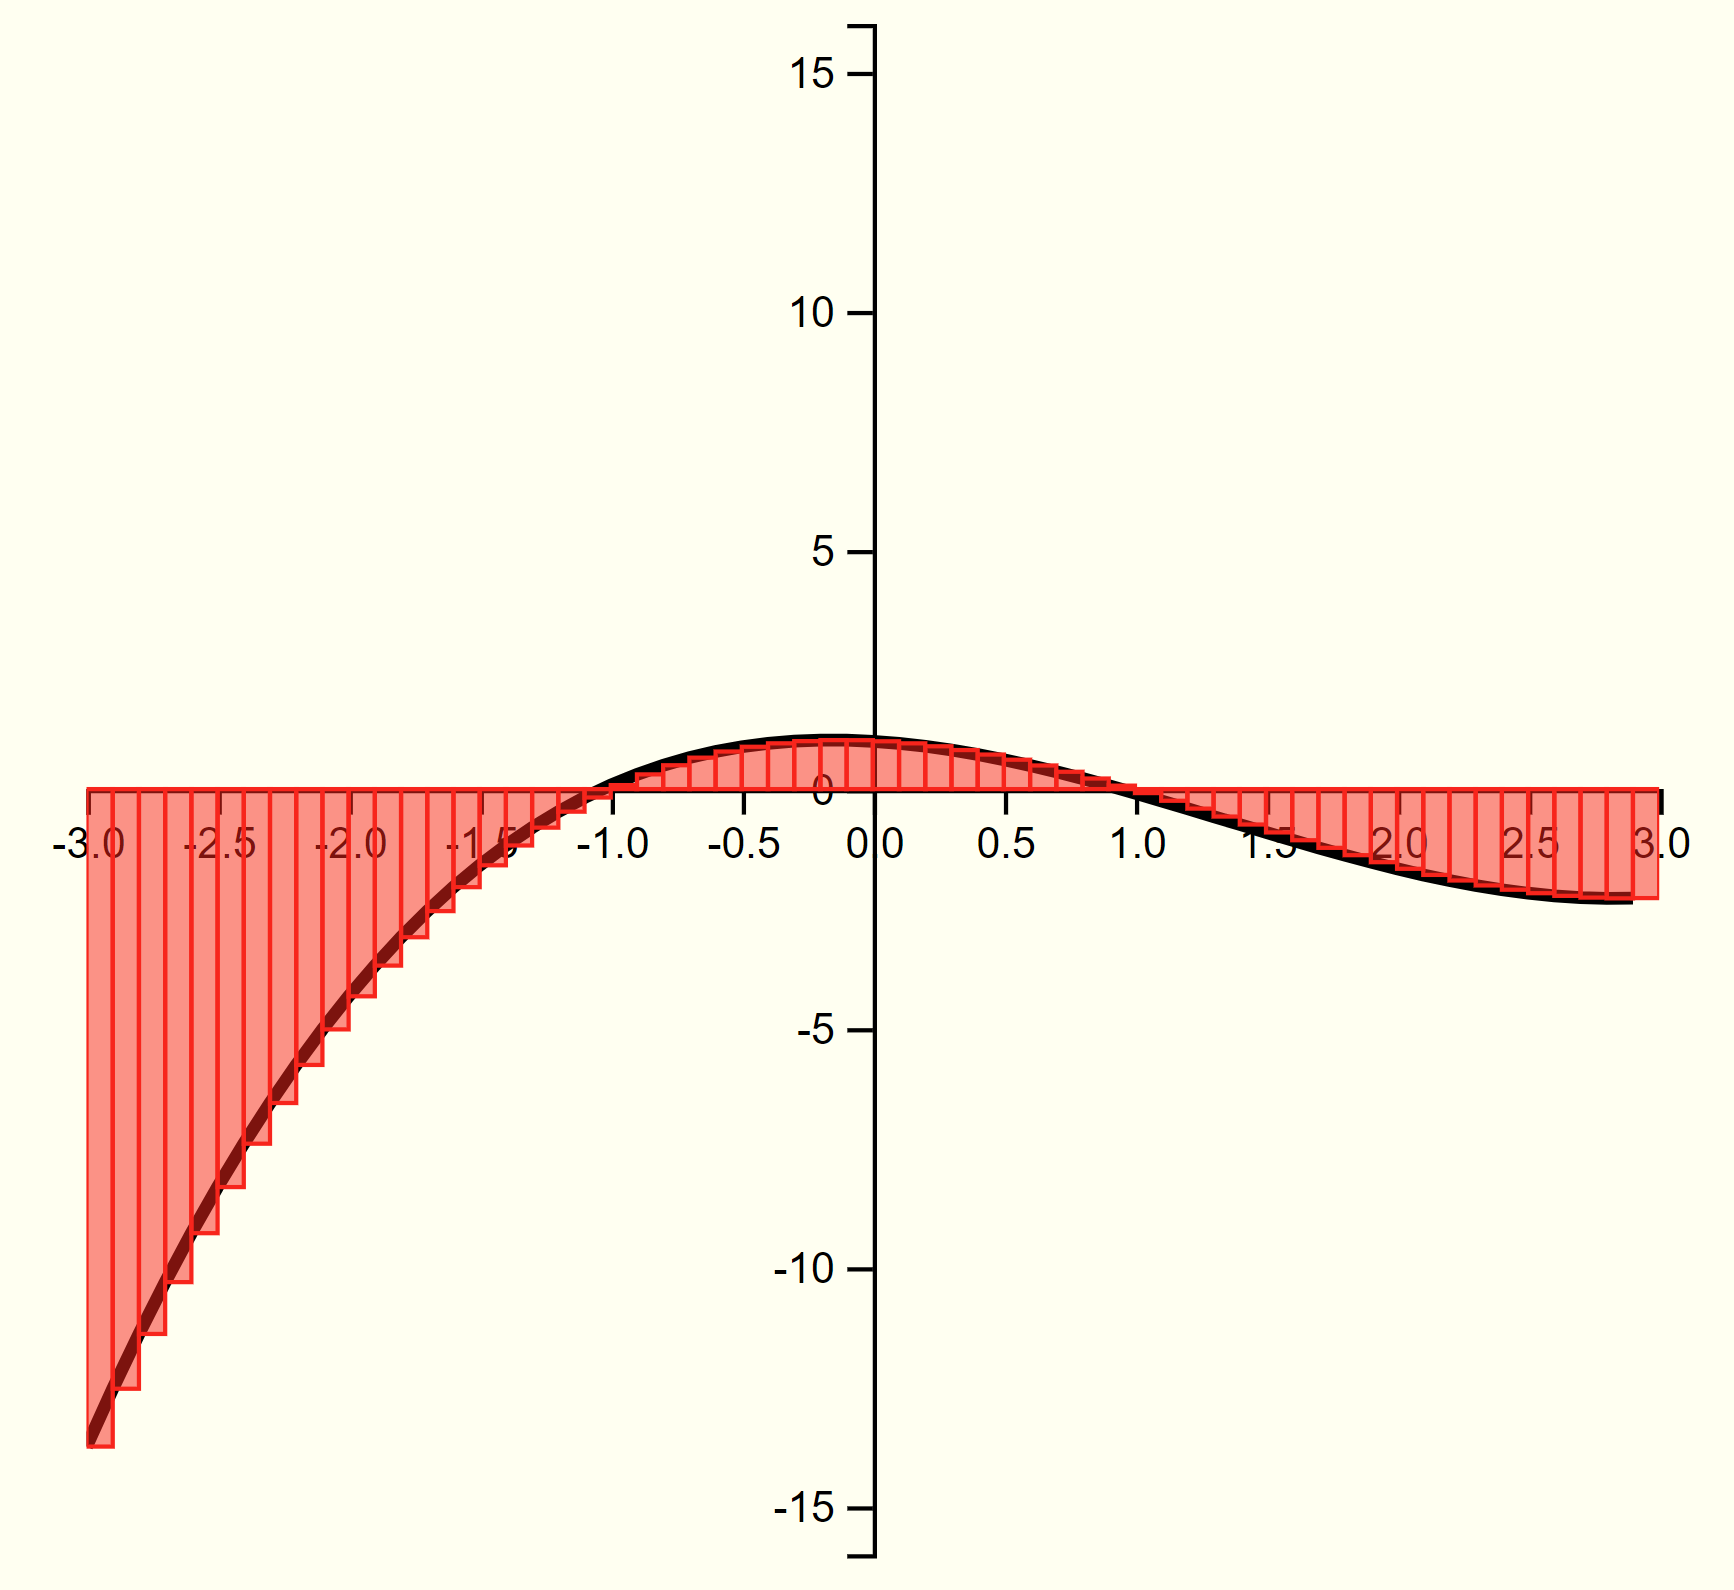
A visual representation of Riemann sums and an estimation of the area under a curve.

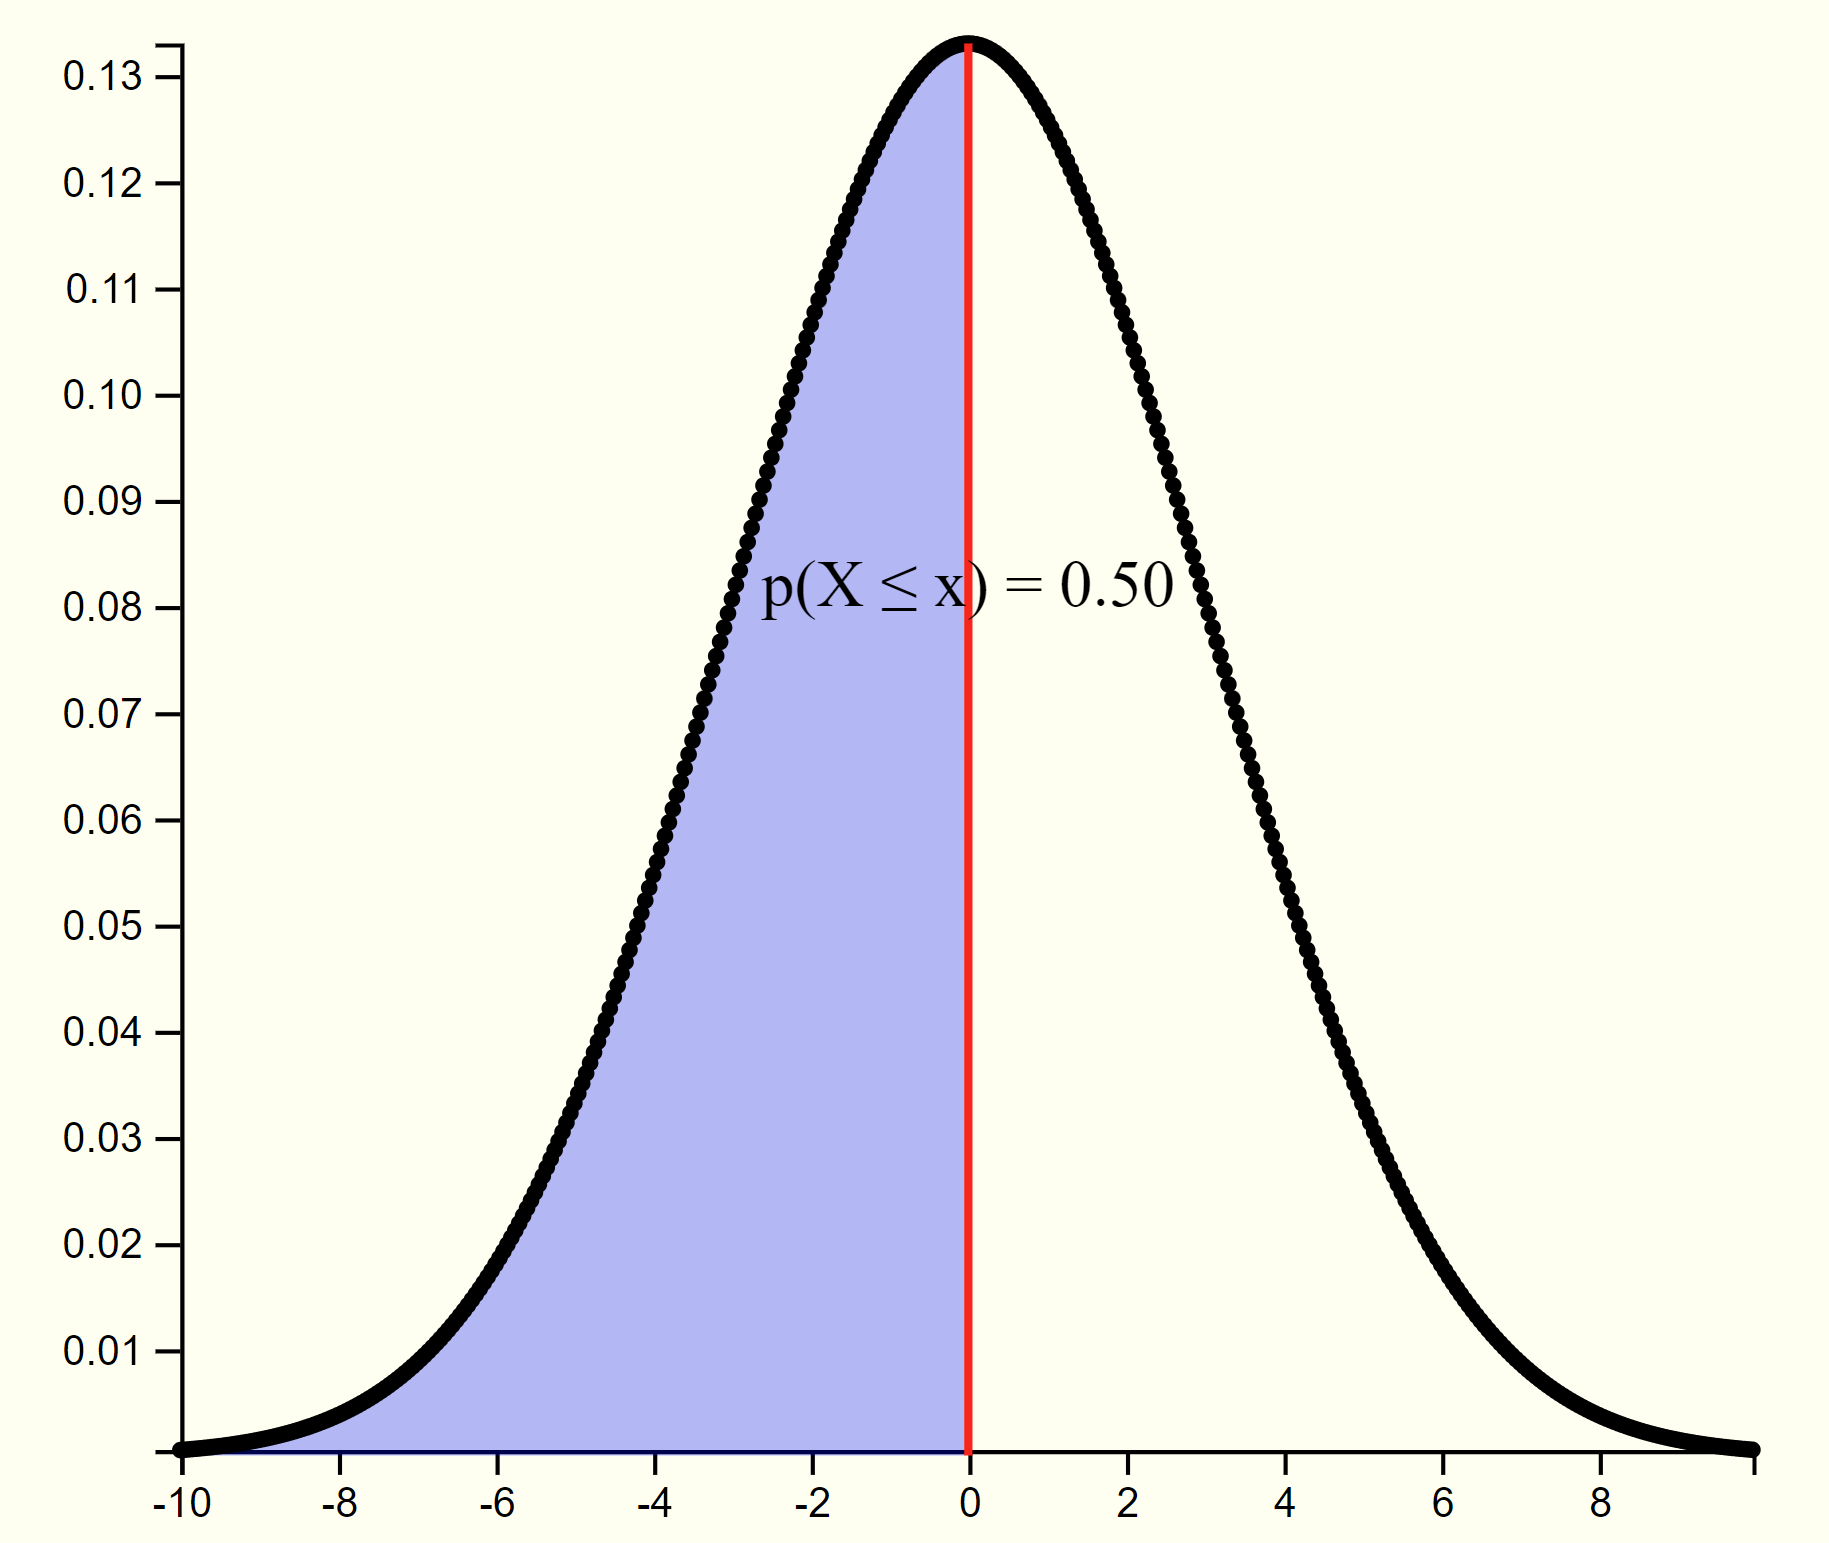
An interactive set of notes that demonstrate the relationship between the CDF and the PDF which is central to
probability and statistics.
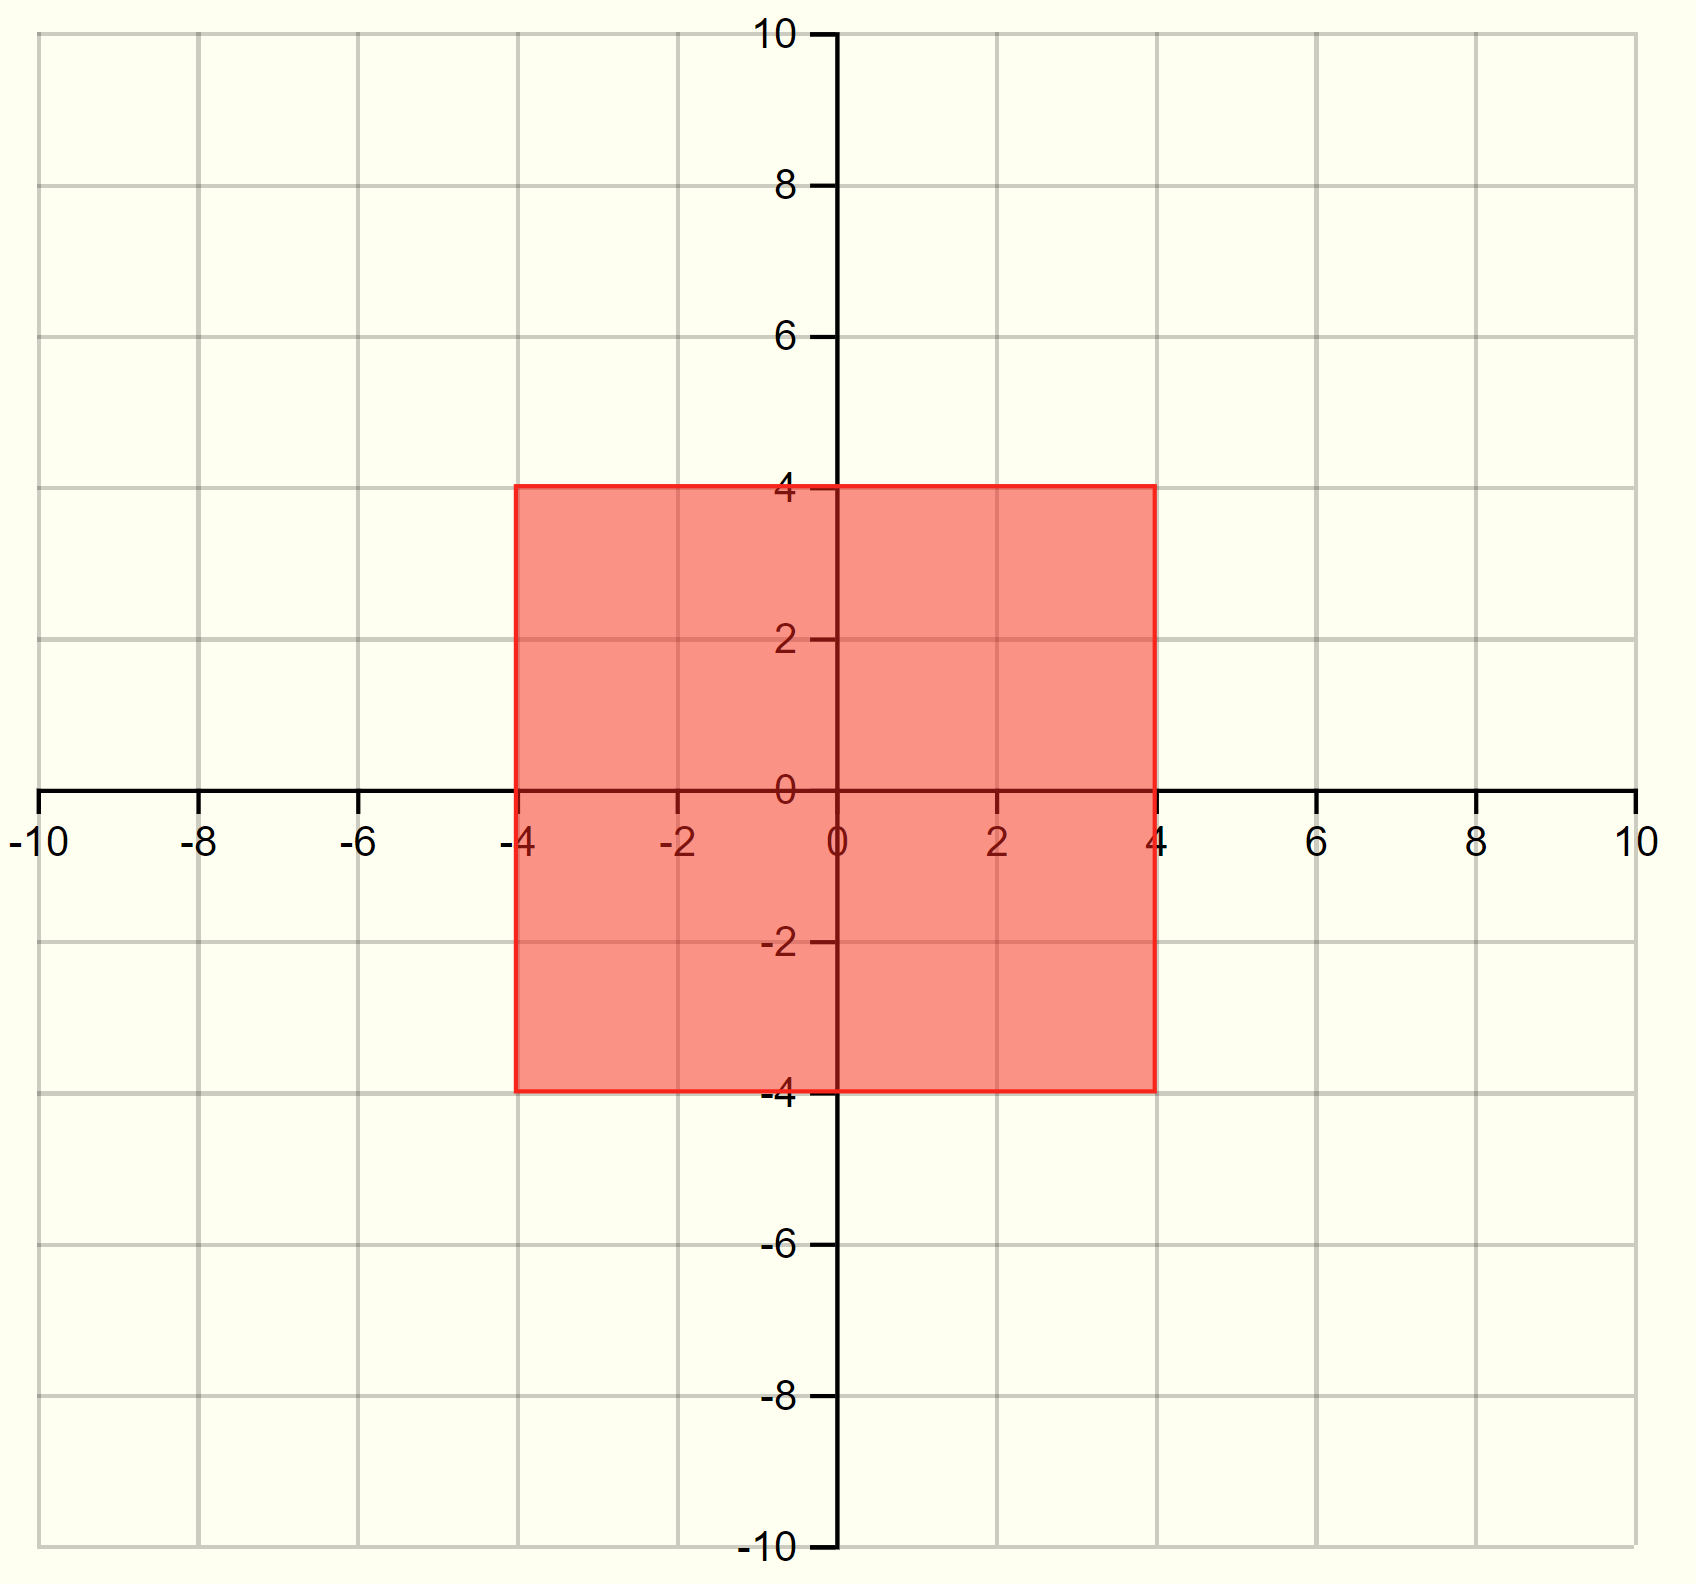
A short introduction to matrices and there relationship to linear transformations.


A key technique for assessing the fit of a statistical model to a dataset.
These notes explain the theory behind
qq plots.

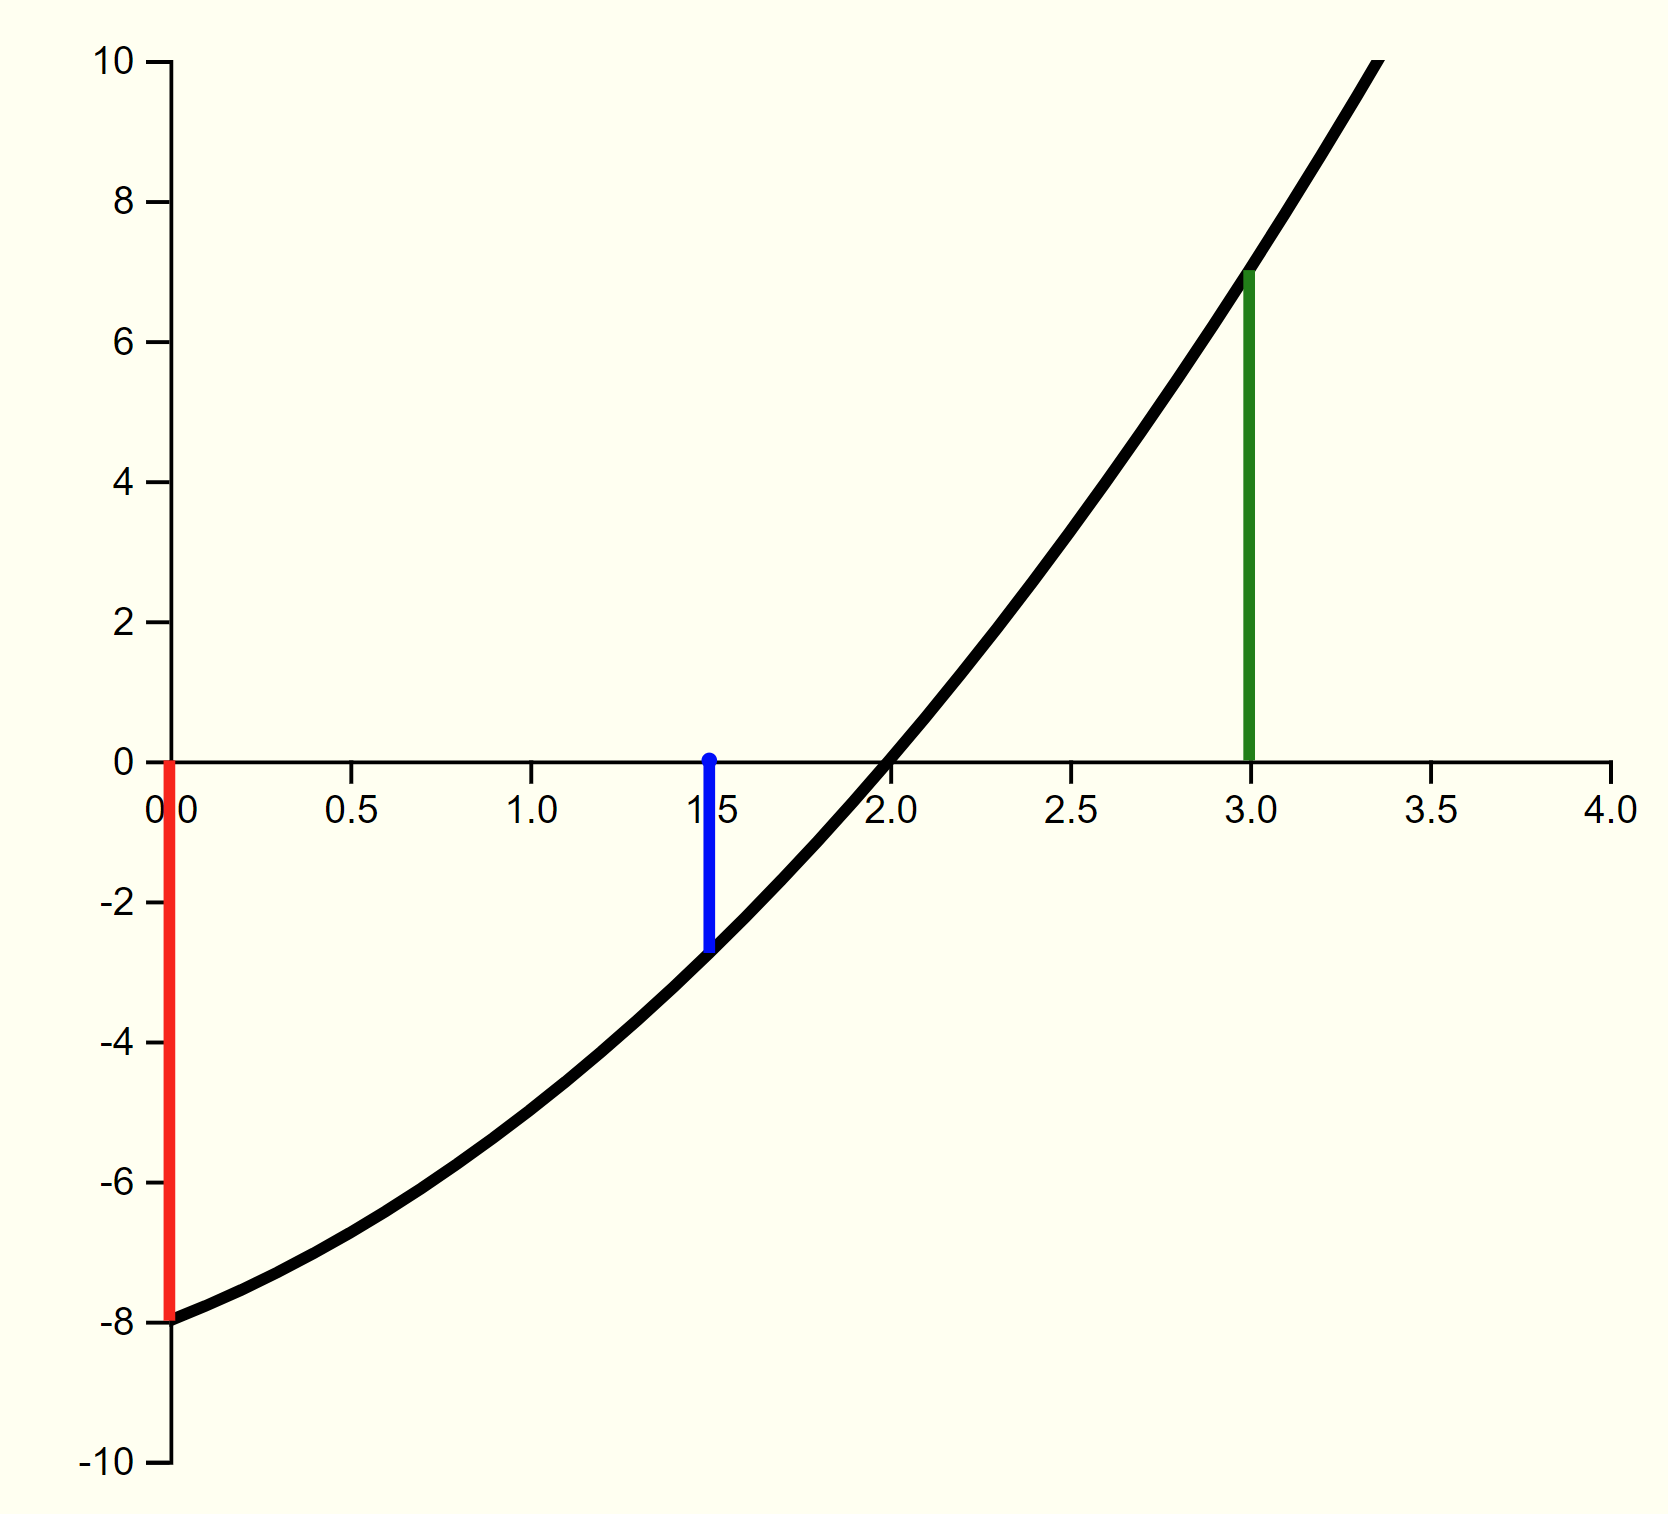
One of the simplest yet most robust numerical methods for estimating the root of a function.
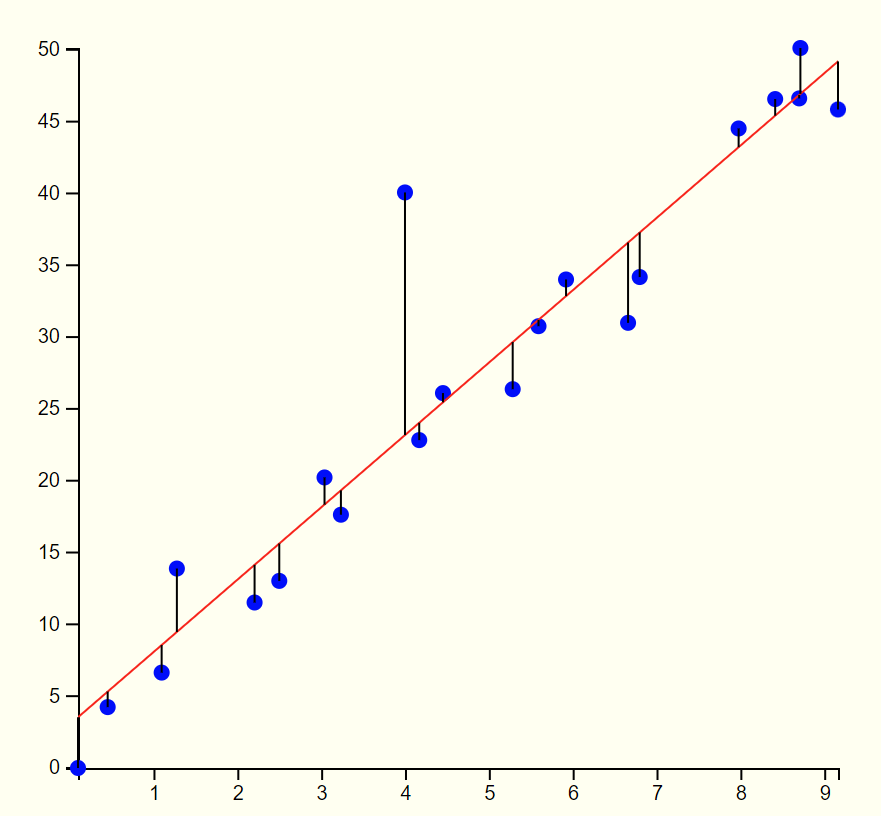
Notes on Cooks distance a popular method for assessing the fit of a linear model and measuring extreme data points.

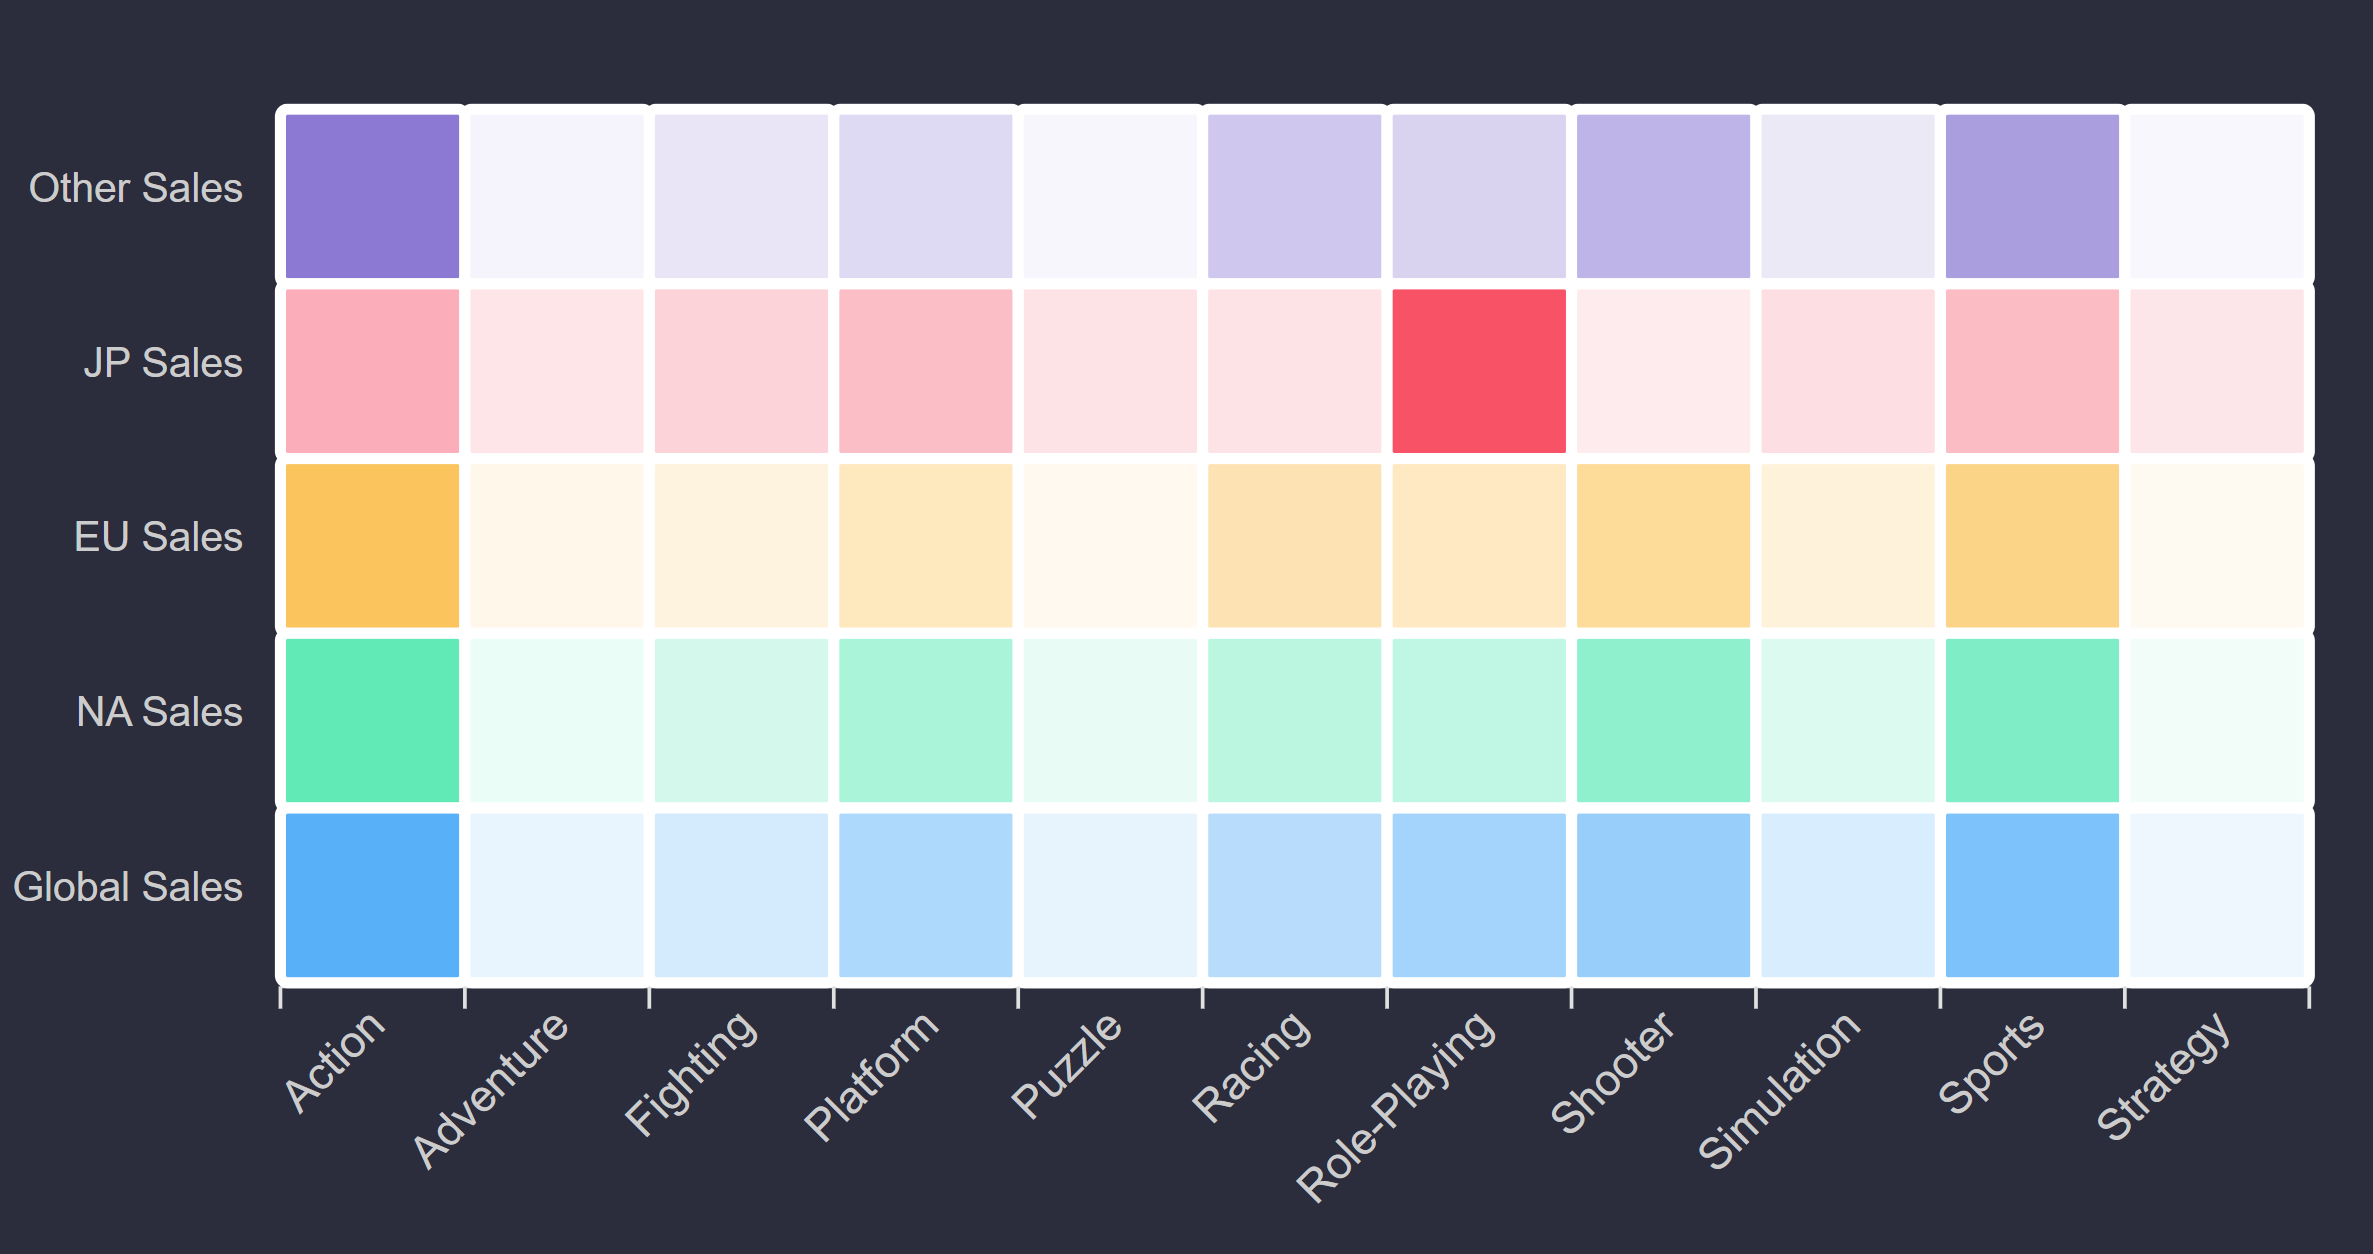
Charts that explore video game sales data. A showcase of more visually appealing data.
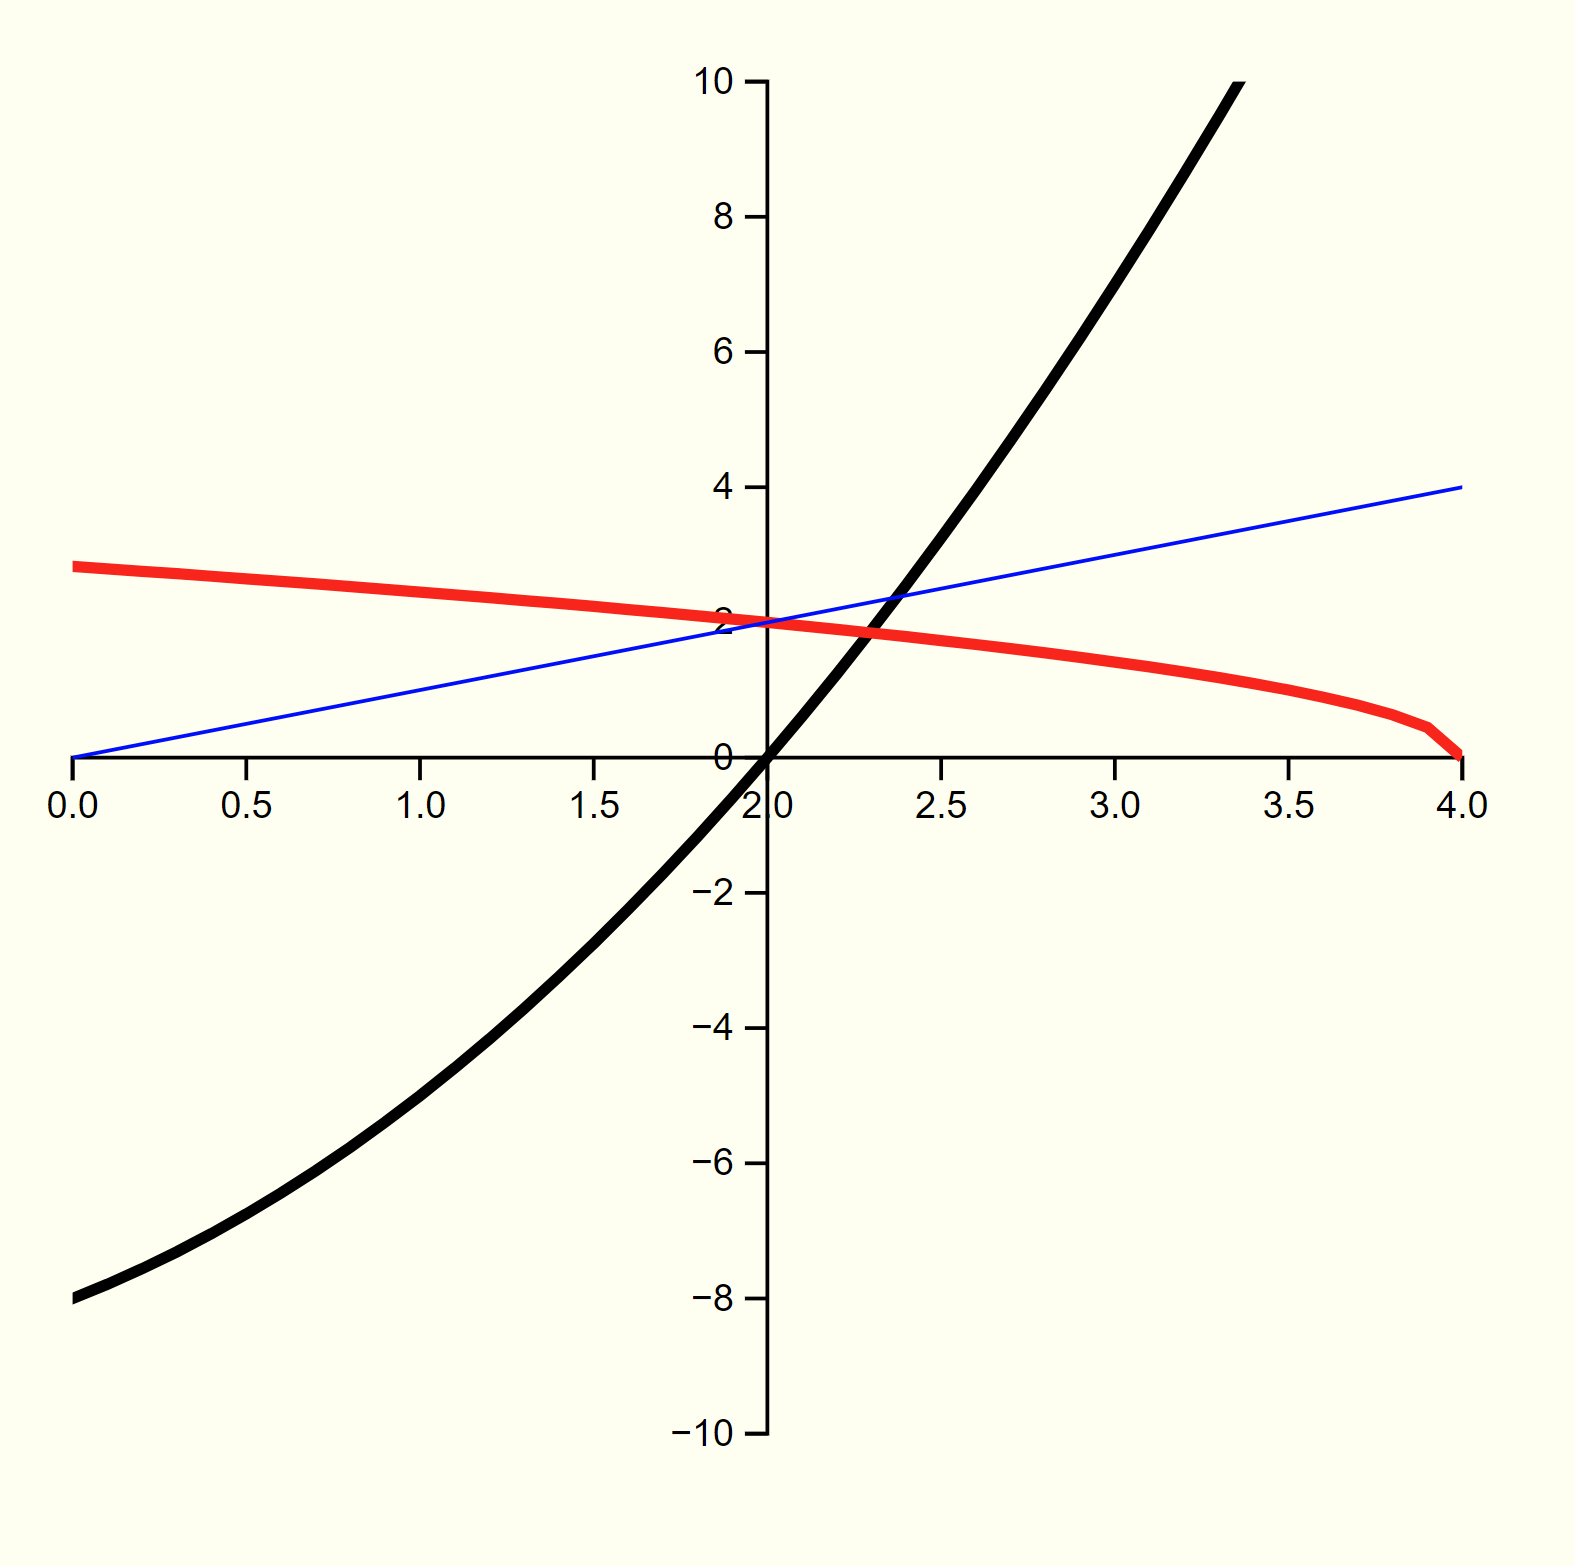
One of the first numerical methods that students will learn is fixed point iteration. These notes offer an interactive explanation.